
How to Calculate CAGR
What is CAGR?
The Compound Annual Growth Rate (CAGR) is one of the most widely used metrics in finance and business analysis. Simply put, it represents the average annual growth of an investment, business, or financial metric over a set period of time, assuming the growth was compounded each year. For anyone evaluating performance, understanding what is CAGR provides a reliable way to smooth out volatility and see the long-term trend.
Unlike simple growth rat
es, which only compare the beginning and ending values, CAGR accounts for the effect of compounding. This makes it especially useful when analyzing investments, business revenues, or stock performance over multiple years. Whether you’re an investor tracking returns or a business leader measuring performance, knowing how to calculate CAGR can reveal whether growth is consistent, sustainable, and comparable to other opportunities.
CAGR is often applied to:
- Investment growth – Evaluating how stocks, mutual funds, or portfolios perform over time.
- Business performance – Tracking revenue, profit, or market share growth across years.
- Stock returns – Comparing different securities or benchmarks on a like-for-like basis.
In short, CAGR simplifies complex growth patterns into a single, easy-to-understand figure, making it an essential tool for financial decision-making.
The Basic CAGR Formula
The CAGR formula provides a simple yet powerful way to calculate the average annual growth rate of an investment, revenue stream, or financial metric over time. It smooths out the fluctuations that may occur year by year and expresses growth as if it happened steadily.
The Formula
[caption id='attachment_28556' align='aligncenter' width='562']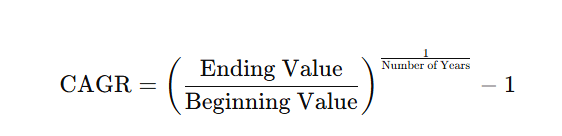 CAGR Formula[/caption]
 Explanation of Each Component
- Beginning Value – The initial investment or financial metric at the start of the period.
- Ending Value – The value of the investment or metric at the end of the period.
- Number of Years – The total time span over which growth is measured.
- – 1 – Subtracting 1 converts the compounded result into a percentage growth rate.
Example: How to Calculate CAGR Manually
Suppose you invested $1,000 in a stock, and after 3 years, the investment grew to $1,500.
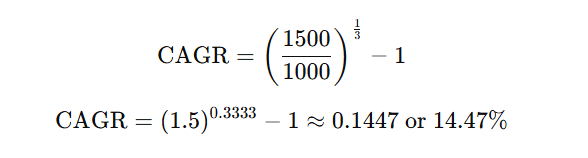
This means your investment grew at an average annual rate of about 14.5%, even if the actual growth varied from year to year.
In short, learning how to calculate CAGR manually provides a reliable method for evaluating long-term growth trends without being distracted by short-term volatility.
How to Calculate CAGR Manually
While spreadsheets and calculators make the process simple, it’s important to understand how to calculate CAGR manually. By breaking it into clear steps, you can work through the formula on paper or with a basic calculator and gain a deeper understanding of how the metric works.
CAGR Calculation Step by Step
Let’s assume an investment grows from $1,000 to $1,500 in 3 years.
-
Write down the formula:
[caption id='attachment_28556' align='aligncenter' width='562'] CAGR Formula[/caption] -
Divide ending value by beginning value:
1500/1000=1.5
-
Take the exponent of (1 ÷ Number of Years):
Since the investment period is 3 years:
1÷3=0.3333
-
Apply the exponent:
1.5^0.3333≈1.1447
-
Subtract 1 to find growth rate:
1.1447−1=0.1447
-
Convert to a percentage:
0.1447×100=14.47%
Final Answer
The investment grew at a CAGR of approximately 14.5% per year over the 3-year period.
This simple walkthrough of CAGR calculation step by step shows how you can evaluate growth without relying on specialized tools, making CAGR a versatile metric in both business and investment analysis.
How to Calculate CAGR in Excel
One of the most practical ways to compute compound annual growth is by using Microsoft Excel. Spreadsheets allow you to quickly compare different growth scenarios and automate calculations. There are two main approaches when learning how to calculate CAGR in Excel: the POWER function and the RATE function.
Method 1: Using the POWER Function
The general CAGR formula in Excel with POWER is:
=POWER(Ending Value / Beginning Value, 1 / Number of Years) - 1
Example:
If an investment grows from $1,000 to $1,500 in 3 years:
=POWER(1500/1000,1/3)-1
This returns 0.1447, or 14.47% CAGR when formatted as a percentage.
Method 2: Using the RATE Function
Excel’s RATE function can also be applied to CAGR:
=RATE(Number of Years, , -Beginning Value, Ending Value)
Example:
=RATE(3, , -1000, 1500)
This also returns 14.47% CAGR.
Example in Table Format
| Beginning Value | Ending Value | Years | CAGR Formula (Excel) | Result |
|---|---|---|---|---|
| $1,000 | $1,500 | 3 | =POWER(1500/1000,1/3)-1 | 14.47% |
| $1,000 | $1,500 | 3 | =RATE(3, , -1000, 1500) | 14.47% |
Both formulas arrive at the same CAGR, giving you flexibility in how you prefer to calculate.
How to Calculate CAGR in Google Sheets
Google Sheets makes it just as easy as Excel to compute compound annual growth. Since the formulas work the same way, learning how to calculate CAGR in Google Sheets is straightforward and requires only a few simple functions.
Method 1: Using the POWER Function
The standard CAGR formula in Google Sheets is:
=POWER(Ending Value / Beginning Value, 1 / Number of Years) - 1
Example:
If an investment grows from $1,000 to $1,500 in 3 years:
=POWER(1500/1000,1/3)-1
his returns 0.1447, or 14.47% CAGR when formatted as a percentage.
Method 2: Using the RATE Function
Google Sheets also supports the RATE function, which can be applied like this:
=RATE(Number of Years, , -Beginning Value, Ending Value)
Example:
=RATE(3, , -1000, 1500)
This also returns 14.47% CAGR.
Quick Example in Table Format
| Beginning Value | Ending Value | Years | Formula (Google Sheets) | Result |
|---|---|---|---|---|
| $1,000 | $1,500 | 3 | =POWER(1500/1000,1/3)-1 | 14.47% |
| $1,000 | $1,500 | 3 | =RATE(3, , -1000, 1500) | 14.47% |
Both approaches in Google Sheets provide the same accurate CAGR, letting users choose whichever method feels more intuitive.
How to Calculate CAGR in a Normal Calculator
Not everyone has access to spreadsheets, so it’s useful to know how to calculate CAGR in a normal calculator. While a scientific calculator makes the process easier, even a basic calculator can get you close to the correct result with a little approximation.
Method 1: Using a Scientific Calculator
-
Divide ending value by beginning value
1500÷1000=1.5
-
Find the exponent (1 ÷ number of years)
For 3 years: 1÷3=0.3333
-
Raise the result to that power
On a scientific calculator, enter: 1.5^0.3333=1.1447
-
Subtract 1 and convert to percentage
1.1447–1=0.1447=14.47%
Method 2: Approximation with a Basic Calculator
If your calculator doesn’t support exponents:
- Divide ending value by beginning value → 1.5
- Estimate the root manually (for a cube root, find a number that when multiplied by itself three times is close to 1.5). Here, 1.1447 × 1.1447 × 1.1447 ≈ 1.5
- Subtract 1 → 0.1447, or 14.47% CAGR
Example Walkthrough
For an investment that grows from $1,000 to $1,500 in 3 years:
- Scientific calculator → 14.47% CAGR
- Basic calculator (approximate cube root of 1.5) → 14.5% CAGR
Knowing how to do this without software ensures you can still compute growth rates quickly when only a regular calculator is available.
How to Calculate CAGR for Different Time Periods
The flexibility of the CAGR formula allows it to be applied to any time horizon. Whether you want to measure short-term or long-term growth, the process is the same: divide the ending value by the beginning value, raise it to the power of 1 divided by the number of years, and subtract 1. Below are examples showing how to calculate 2 year CAGR and how to calculate 5 year CAGR.
2-Year CAGR Example
Suppose an investment grows from $2,000 to $2,640 in 2 years.
[caption id='attachment_28559' align='aligncenter' width='696']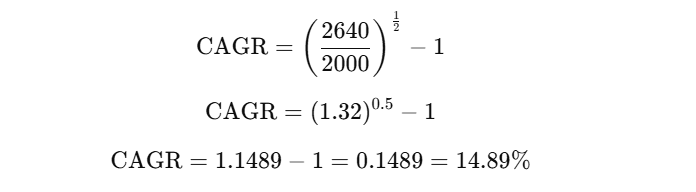 2-Year CAGR Example[/caption]
 So the 2-year CAGR is 14.9%, showing the average annual growth rate over two years.
5-Year CAGR Example
Now assume the same $2,000 grows to $4,000 in 5 years.
[caption id='attachment_28560' align='aligncenter' width='690']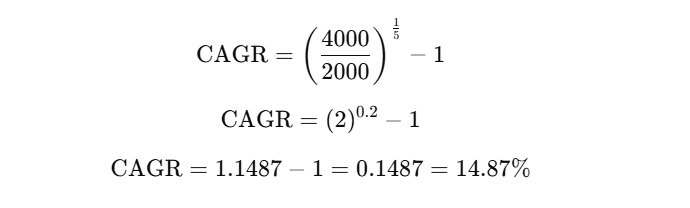 5-Year CAGR Example[/caption]
 So the 5-year CAGR is 14.87%, very close to the 2-year rate, but reflecting long-term compounding.
Comparison of Results
- The 2-year CAGR shows short-term performance, useful for evaluating fast growth.
- The 5-year CAGR smooths out fluctuations, providing a more reliable view of long-term sustainability.
Both calculations highlight how CAGR adapts to different timeframes, making it one of the most versatile metrics for financial and business analysis.
Special Cases in CAGR Calculation
While CAGR is most often used to track positive growth, there are special situations where additional care is needed. Two common scenarios are when you want to calculate CAGR from a total absolute return and when investments decline, requiring how to calculate CAGR with negative numbers.
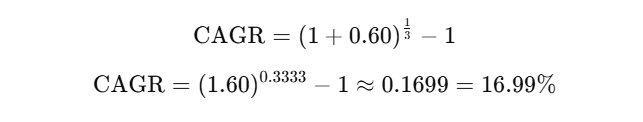
1. CAGR from Absolute Return
Sometimes you know the overall return over a time period (absolute return) but want to find the annualized CAGR. The formula is the same:
CAGR=(1+Total Return) 1/Number of Years−1
Example:
If an investment grows 60% in 3 years, the absolute return is 0.60.
2. CAGR with Negative Numbers
Declines in value can also be measured using CAGR. If the ending value is lower than the beginning value, the formula will yield a negative CAGR, indicating an average annual loss.
Example:
If an investment drops from $10,000 to $7,000 in 3 years:
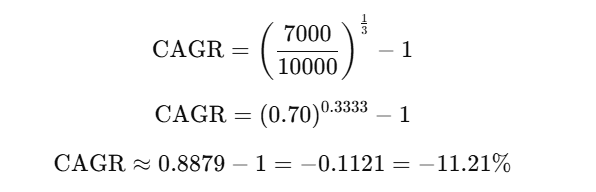
This means the investment lost an average of 11.2% per year.
Key Insight
- Absolute Return → CAGR: Converts total growth over multiple years into a comparable annual rate.
- Negative Numbers → CAGR: Reveals the average yearly decline, making it useful for risk analysis.
Understanding these special cases ensures you can apply CAGR correctly to both profitable and declining scenarios.
How to Calculate CAGR of Stock Investments
CAGR is one of the most practical tools for evaluating long-term stock performance. It allows investors to understand the average annual return of a stock, smoothing out year-to-year volatility. Learning how to calculate CAGR of stock is straightforward, as it uses the same formula applied to other assets.
Step-by-Step Calculation
- Identify the beginning price – the stock’s price at the start of the period.
- Identify the ending price – the stock’s price at the end of the period.
- Account for dividends (if applicable) – include reinvested dividends to get a more accurate return.
- Apply the CAGR formula:
Practical Example
Suppose you bought a stock at $50 per share, and after 4 years, its price rose to $120 (ignoring dividends for simplicity).
[caption id='attachment_28563' align='aligncenter' width='645']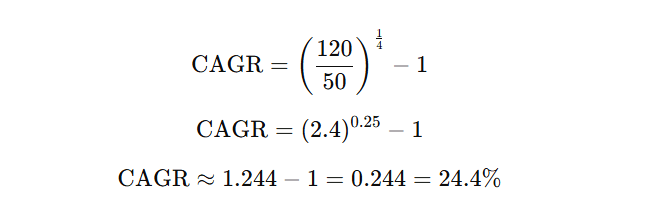 Calculate CAGR of Stock Investments[/caption]
 So, the stock achieved an average annual growth rate of 24.4% over the 4-year period.
Why CAGR is Useful in the Stock Market
- Smooths out short-term price fluctuations.
- Allows easy comparison between different stocks, mutual funds, or benchmarks.
- Provides a realistic picture of long-term performance.
In summary, applying CAGR in stock market analysis helps investors focus on sustainable growth trends rather than short-term volatility.
Common Mistakes to Avoid in CAGR Calculation
While CAGR is a powerful tool for analyzing growth, it can be misused if applied incorrectly. Being aware of common CAGR mistakes helps ensure accurate financial analysis and better decision-making.
1. Confusing CAGR with Average Annual Return
A frequent error is assuming CAGR is the same as taking a simple average of yearly returns. In reality, CAGR accounts for compounding, while an average return does not. This distinction between CAGR vs annual return is critical, as CAGR provides a more accurate reflection of long-term growth.
2. Ignoring Irregular Cash Flows
CAGR is best used for investments with a single beginning and ending value. If there are irregular cash inflows or outflows (such as multiple investments over time), CAGR may not capture the full picture. In these cases, the Internal Rate of Return (IRR) is a more appropriate measure.
3. Misinterpreting Negative CAGR
Another mistake is misreading a negative CAGR. A negative value simply means the investment declined on average each year, not that losses were identical annually. For example, a stock dropping from $100 to $60 in 3 years will show a negative CAGR, which should be understood as an average annual decline.
4. Overlooking Time Frame Differences
Comparing CAGR across investments without aligning time periods can be misleading. A 2-year CAGR may show rapid short-term growth, while a 10-year CAGR smooths volatility and gives a more sustainable view.
By avoiding these CAGR mistakes, investors and analysts can use CAGR more effectively as a reliable measure of performance.
FAQs on CAGR
What is a good CAGR for investments?
A “good” CAGR depends on the type of investment and risk profile. For stocks, a CAGR of 7–10% is often considered strong, while for safer investments like bonds, even 3–5% may be attractive. In general, higher CAGRs suggest better growth, but they often come with higher risk.
Is CAGR always accurate for stock returns?
Not always. While CAGR is useful for smoothing out volatility, it doesn’t reflect year-to-year fluctuations. A stock may have extreme highs and lows during the investment period, yet the CAGR only shows the average growth. For this reason, CAGR in finance should be used alongside other metrics like standard deviation or Sharpe ratio to evaluate risk.
Can I calculate CAGR for less than one year?
Yes, but it is less common. CAGR can be applied to periods shorter than one year by adjusting the formula to use fractions of a year. For example, 6 months would be expressed as 0.5 years. However, CAGR is most meaningful over multi-year horizons where compounding plays a larger role.
Which is better: CAGR or IRR?
CAGR and IRR serve different purposes.
- CAGR: Best for measuring growth between one starting value and one ending value over time.
- IRR (Internal Rate of Return): Better for evaluating projects or investments with multiple cash inflows and outflows.
In short, CAGR is simpler and more widely used, while IRR provides a deeper analysis when cash flows are irregular.
Conclusion
The Compound Annual Growth Rate (CAGR) remains one of the simplest yet most powerful tools for evaluating growth in finance and business. By focusing on consistent annualized returns, CAGR cuts through short-term volatility and offers a clear picture of long-term performance. Whether you’re analyzing investments, business revenues, or stock market trends, knowing how to calculate CAGR ensures more accurate comparisons and smarter decision-making.
The good news is that anyone can master this metric. From a step-by-step manual calculation to Excel, Google Sheets, or even a basic calculator, there are multiple ways to apply CAGR in real-world scenarios. Using this CAGR calculation guide, you can start practicing with your own numbers and build confidence in evaluating growth across different time periods.
Now is the time to take action—open a spreadsheet, plug in your data, and calculate CAGR for your investments or business performance. The more you practice, the more you’ll understand how this metric can guide better financial strategies and long-term success.
Also Read:
How to Prepare a Cash Flow Statement